#
AutoAttend Cost Calculator
This document provides a comprehensive overview of the AutoAttend Cost Calculator, a tool designed to help educational institutions estimate the financial implications of deploying the facial recognition attendance system. The calculator offers a transparent view of potential costs based on configuration choices.
#
Calculator Overview
The AutoAttend Cost Calculator provides estimated costs across four main categories:
- Infrastructure Costs - Physical computing resources required for operation
- Model Selection - Impact of AI model choices on performance and cost
- Processing Settings - Runtime configuration that affects resource utilization
- Deployment Scale - Scope and scale of the implementation
#
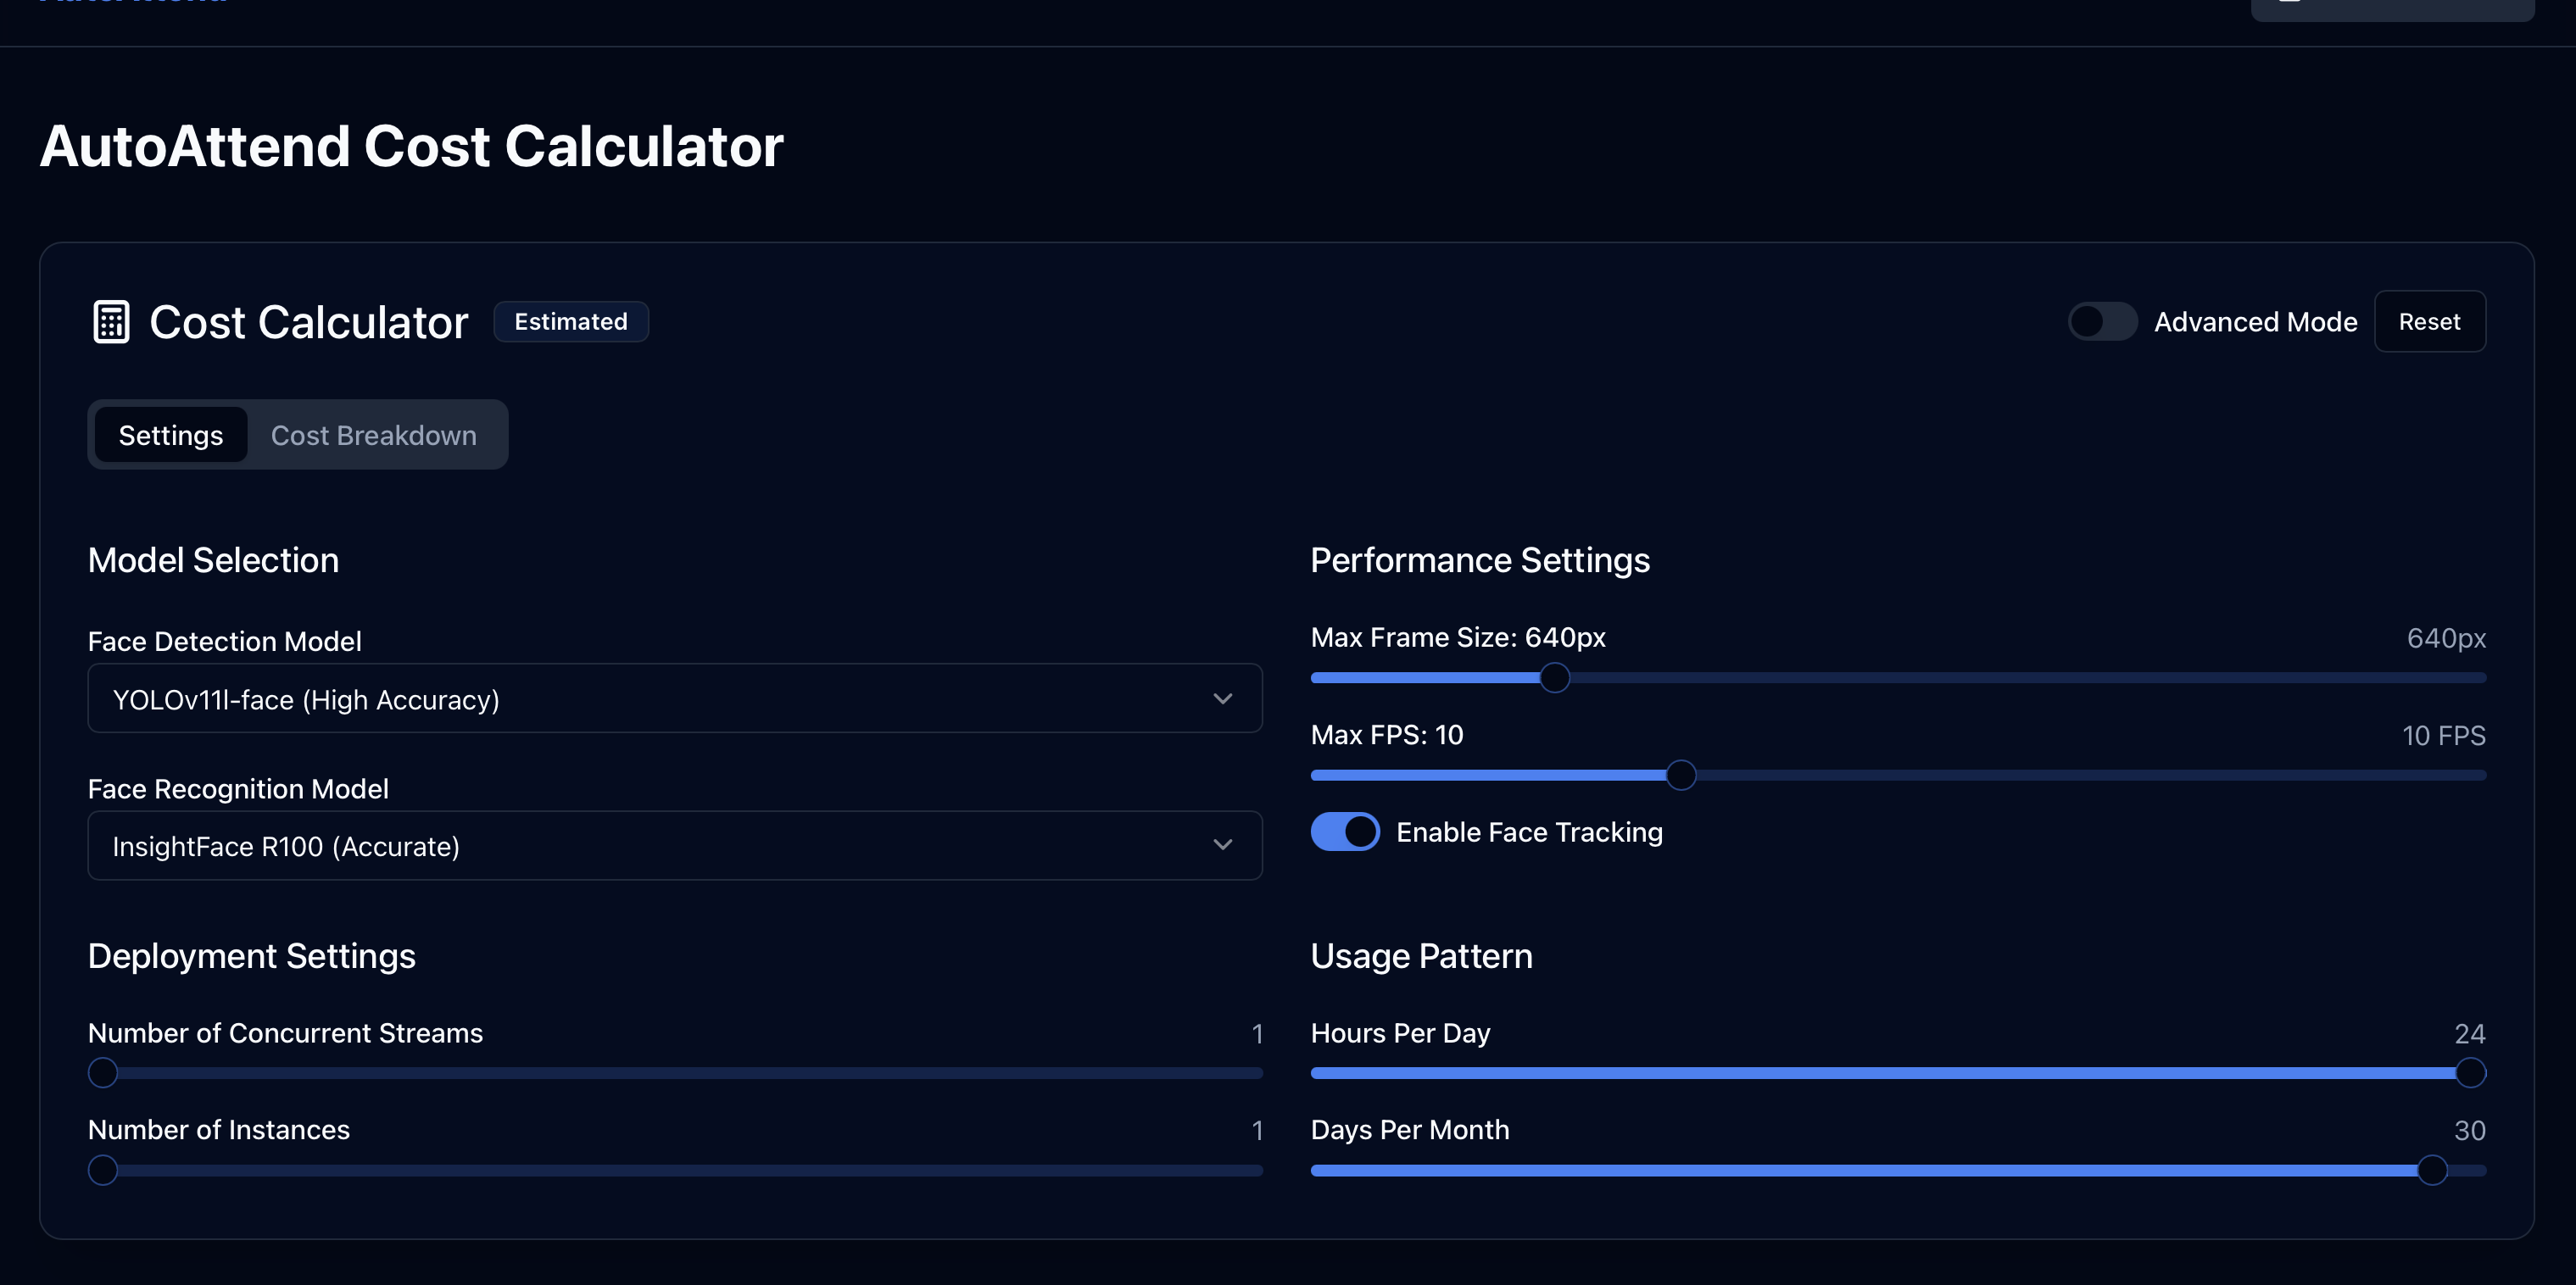
Calculator Interface
The calculator interface is organized into tabbed sections for intuitive navigation:
#
Model Selection
The model selection significantly impacts both system performance and overall costs. The calculator allows you to choose between different face detection and recognition models to balance accuracy and resource requirements.
flowchart TD
    subgraph "Face Detection Models"
        style FaceDetection fill:#e3f2fd,stroke:#1565c0,stroke-width:2px
        YOLOv8n["YOLOv8n<br>Fastest (smallest)"]
        YOLO11n["YOLO11n<br>Fast"]
        YOLOv11s["YOLOv11s<br>Medium"]
        YOLOv11l["YOLOv11l<br>Most Accurate"]

        YOLOv8n -->|"Speed ↑<br>Cost ↓"| YOLO11n
        YOLO11n -->|"Speed ↓<br>Cost ↑"| YOLOv11s
        YOLOv11s -->|"Speed ↓<br>Cost ↑"| YOLOv11l

        style YOLOv8n fill:#bbdefb,stroke:#1565c0,color:black
        style YOLO11n fill:#90caf9,stroke:#1565c0,color:black
        style YOLOv11s fill:#64b5f6,stroke:#1565c0,color:black
        style YOLOv11l fill:#42a5f5,stroke:#1565c0,color:black
    end

    subgraph "Face Recognition Models"
        style FaceRecognition fill:#e8f5e9,stroke:#2e7d32,stroke-width:2px
        R50["InsightFace R50<br>Faster"]
        R100["InsightFace R100<br>More Accurate"]

        R50 -->|"Speed ↓<br>Cost ↑"| R100

        style R50 fill:#a5d6a7,stroke:#2e7d32,color:black
        style R100 fill:#81c784,stroke:#2e7d32,color:black
    end

    CostImpact["Cost<br>Impact"] --> FaceDetection
    CostImpact --> FaceRecognition

    style CostImpact fill:#fff3e0,stroke:#e65100,stroke-width:2px,color:black
#
Performance Settings
Performance settings directly impact resource utilization and consequently affect the overall cost of deployment.
#
Max Frame Size
The maximum frame size determines the resolution of video frames processed for face detection. This can be obtained from the camera specs.
- Range: 320-1920 pixels
- Lower values (e.g., 320-480px): Lower cost, reduced accuracy
- Higher values (e.g., 1280-1920px): Higher cost, improved accuracy
- Cost Impact: Higher resolutions increase processing and network costs significantly
#
Max FPS (Frames Per Second)
The maximum number of frames processed per second.
- Range: 1-30 FPS
- Lower values (e.g., 1-5 FPS): Lower cost, suitable for static environments
- Higher values (e.g., 15-30 FPS): Higher cost, better for dynamic environments
- Cost Impact: Each additional frame increases computational resource requirements linearly
#
Face Tracking
Face tracking allows the system to follow faces across frames without full detection on every frame.
- Enabled: Slightly higher cost but improves efficiency for continuous monitoring
- Disabled: Lower immediate cost but may require more frequent full-frame detections
- Cost Impact: Modest increase in computational needs, generally cost-effective for continuous operation
#
Deployment Settings
Deployment settings define the scale and scope of your AutoAttend implementation.
#
Number of Concurrent Streams
The number of camera feeds processed simultaneously.
- Range: 1-10 streams
- Cost Impact: Linear scaling of processing and resource requirements per stream
#
Number of Instances
The number of processing instances deployed (for load balancing or redundancy).
- Range: 1-5 instances
- Cost Impact: Linear scaling of infrastructure costs per instance
#
Usage Pattern
The usage pattern defines when and how often the system will be operational.
#
Operational Hours
The total time the system will be active, measured in hours per day and days per month.
- Hours Range: 1-24 hours per day
- Days Range: 1-31 days per month
- Optimization Tip: Configuring precise operational hours to match actual class schedules can significantly reduce costs
#
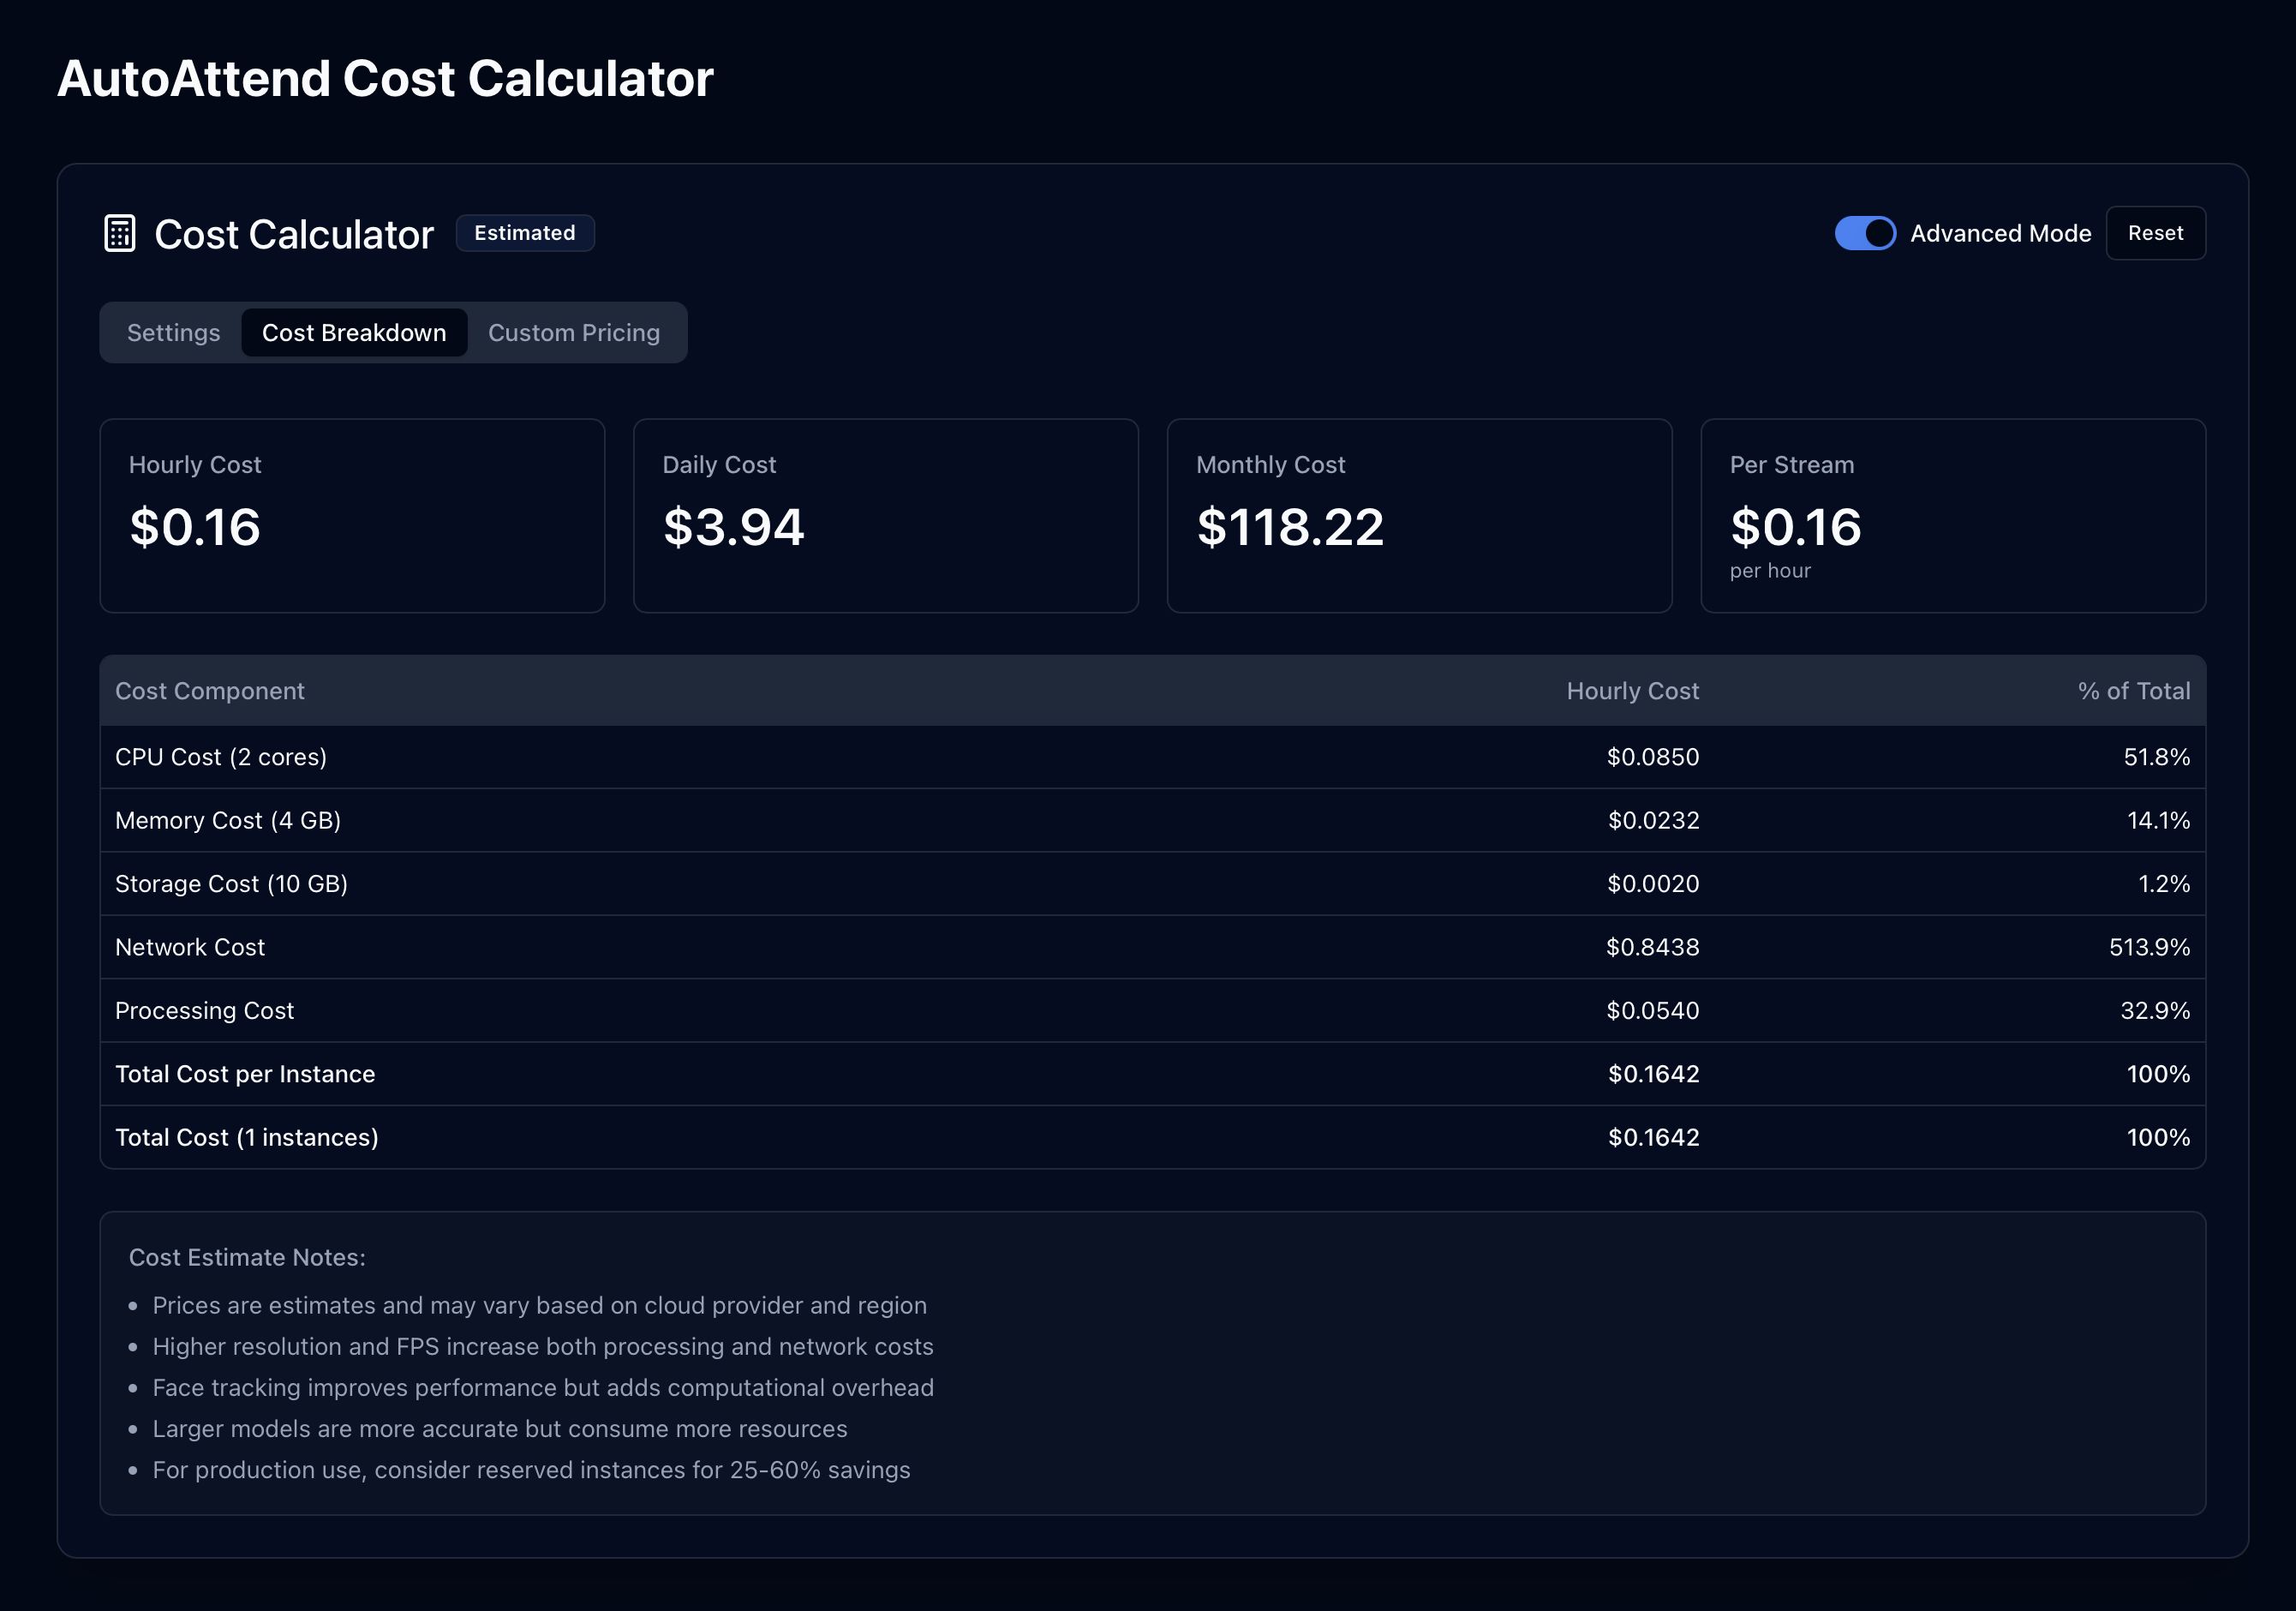
Cost Breakdown
The calculator provides a comprehensive cost breakdown across multiple time horizons.
flowchart TB
    subgraph "Cost Components"
        style CostComponents fill:#e3f2fd,stroke:#1565c0,stroke-width:2px

        Infrastructure["Infrastructure Costs"]
        Processing["Processing Costs"]
        Network["Network Costs"]

        Infrastructure --> CPU["CPU Allocation"]
        Infrastructure --> Memory["Memory Allocation"]
        Infrastructure --> Storage["Storage Allocation"]

        Processing --> ModelComplexity["AI Model Complexity"]
        Processing --> FrameSize["Frame Size Impact"]
        Processing --> FrameRate["Frame Rate Impact"]
        Processing --> TrackingOverhead["Tracking Overhead"]

        Network --> DataTransfer["Data Transfer Volume"]
        Network --> StreamCount["Stream Count"]
    end

    subgraph "Time Horizons"
        style TimeHorizons fill:#e8f5e9,stroke:#2e7d32,stroke-width:2px

        Hourly["Hourly Cost"]
        Daily["Daily Cost"]
        Monthly["Monthly Cost"]
        PerStream["Per-Stream Cost"]
    end

    CostComponents --> TimeHorizons

    style Infrastructure fill:#bbdefb,stroke:#1565c0,color:black
    style Processing fill:#90caf9,stroke:#1565c0,color:black
    style Network fill:#64b5f6,stroke:#1565c0,color:black

    style CPU fill:#e3f2fd,stroke:#1565c0,color:black
    style Memory fill:#e3f2fd,stroke:#1565c0,color:black
    style Storage fill:#e3f2fd,stroke:#1565c0,color:black

    style ModelComplexity fill:#e3f2fd,stroke:#1565c0,color:black
    style FrameSize fill:#e3f2fd,stroke:#1565c0,color:black
    style FrameRate fill:#e3f2fd,stroke:#1565c0,color:black
    style TrackingOverhead fill:#e3f2fd,stroke:#1565c0,color:black

    style DataTransfer fill:#e3f2fd,stroke:#1565c0,color:black
    style StreamCount fill:#e3f2fd,stroke:#1565c0,color:black

    style Hourly fill:#c8e6c9,stroke:#2e7d32,color:black
    style Daily fill:#a5d6a7,stroke:#2e7d32,color:black
    style Monthly fill:#81c784,stroke:#2e7d32,color:black
    style PerStream fill:#66bb6a,stroke:#2e7d32,color:black
#
Cost Summary Cards
The calculator provides at-a-glance cost summaries across different time periods:
#
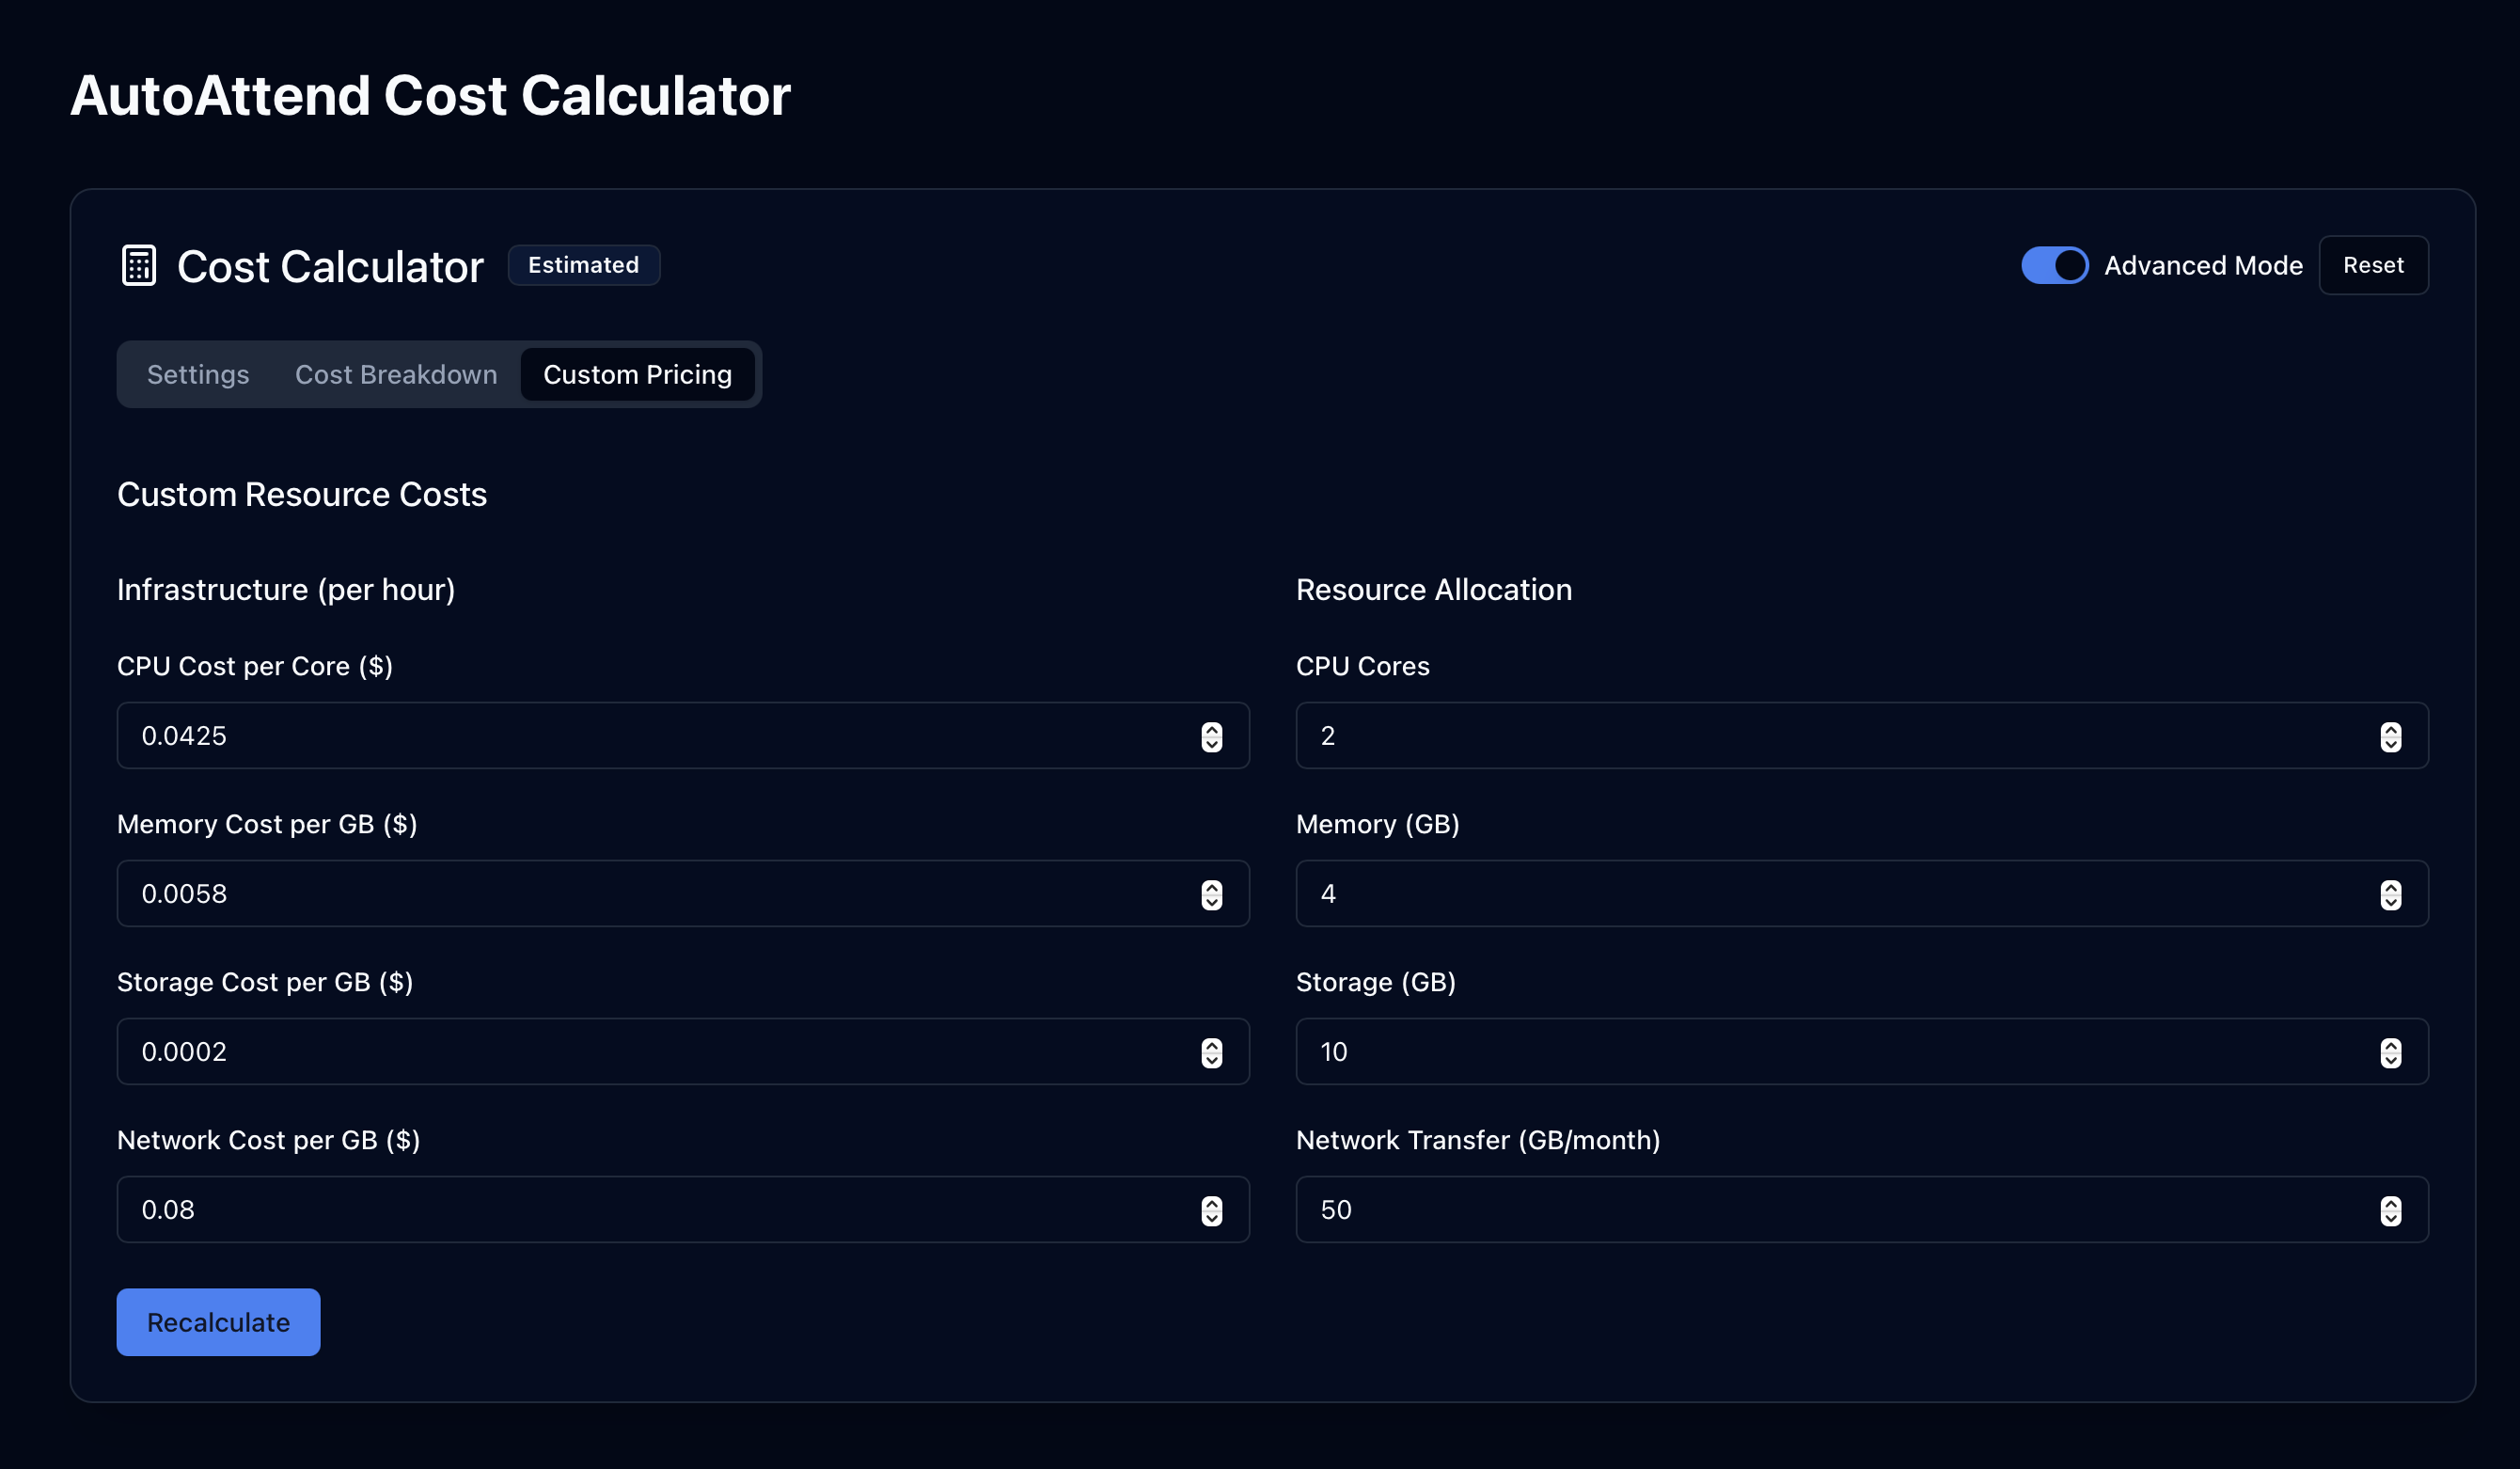
Advanced Mode
For institutions with specific pricing information or custom infrastructure requirements, the calculator offers an advanced mode.
#
Customizable Parameters
- Infrastructure costs (CPU, memory, storage, network)
- Resource allocation specifics
- Custom pricing based on specific cloud providers or on-premises deployments
#
Implementation Considerations
#
Cost Optimization Strategies
The calculator can help identify optimal configurations based on your institution's specific needs:
- Scale-Optimized: Maximize number of streams with minimal resource allocation
- Performance-Optimized: Prioritize accuracy and responsiveness over cost
- Balanced: Find the optimal middle ground between cost and performance
#
Deployment Scenarios
Note
The cost estimates provided by the calculator are approximations based on typical cloud infrastructure pricing.
Actual costs may vary based on your specific provider, region, and negotiated rates.
#
Best Practices
#
Getting Accurate Estimates
To get the most accurate cost estimates:
- Configure the calculator to match your specific deployment scenario
- Consider both peak and average usage patterns
- Adjust settings to find the optimal balance between cost and performance
- Use advanced mode if you have specific pricing information
#
Cost-Effective Configuration
For most educational institutions, we recommend:
- Start with a balanced configuration
- Monitor actual usage patterns after initial deployment
- Adjust parameters based on real-world performance and costs
- Consider scaling up during peak periods (beginning/end of semesters)
#
Related Documentation
For comprehensive information about the complete AutoAttend system, please refer to:
- AutoAttend Architecture - System architecture and deployment
- Registration System - Student enrollment and face embedding capture
- Face Recognition Settings - Detailed face recognition configuration